Graphs
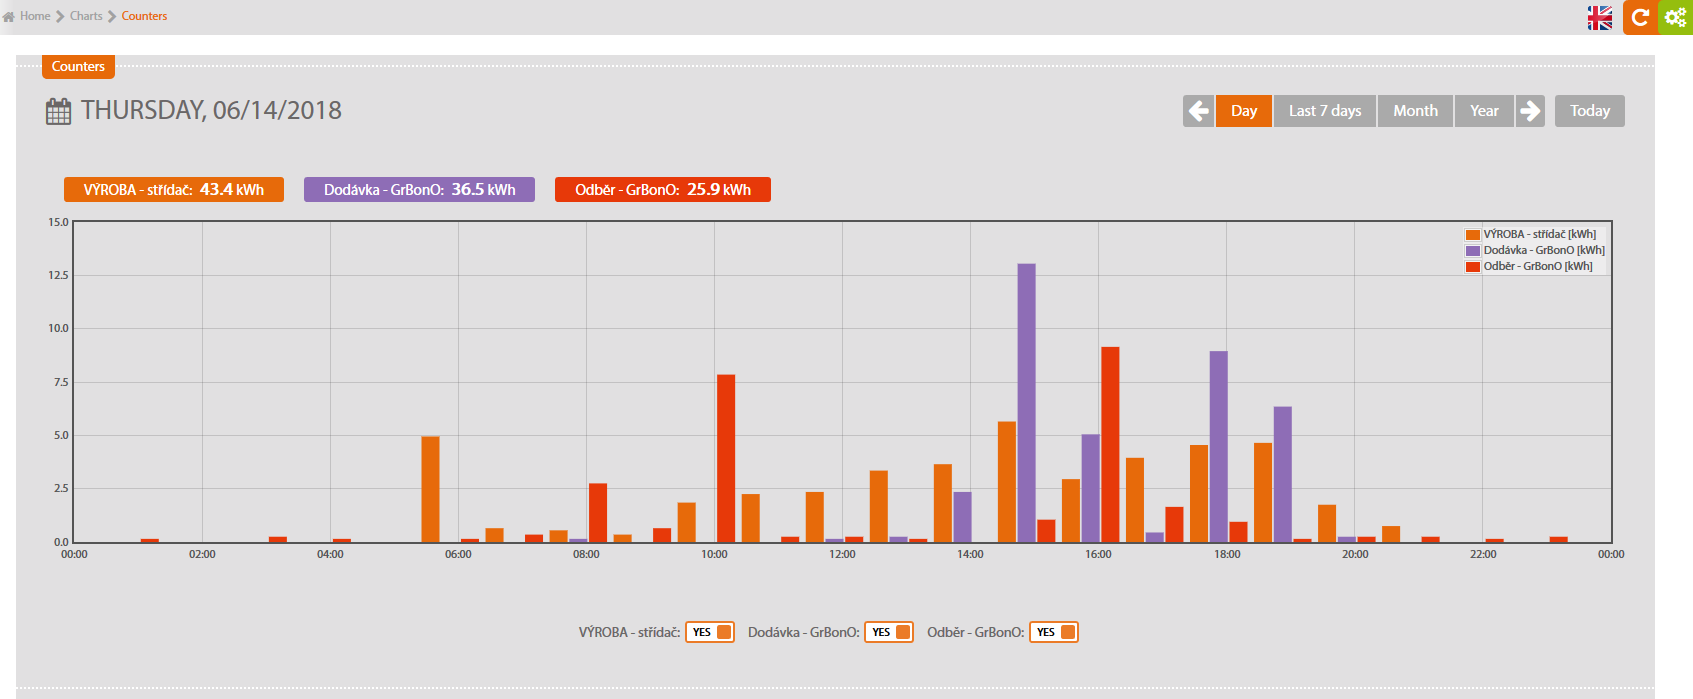
Daily, Weekly, Annual Graph
These graphs show values of each connected meters and power produced. There is automatic zoom function when you select particular meter. When you run a mouse on a bar, the value and time entry are shown.
Notice: if you need more detailed summary, ask for info on using our portal. See www.solarmonitor.cz
