Sensors
It presents and compares the data from connected sensors.
Graph's time period
Graph can show one day, month or a year period. Daily graph shows 24 samples of each value. Monthly and annual graphs show one sample for each value per day. Time period stipulates the day (days) shown in the graph.
 button Previous shifts time period one day backward. With daily time period we can click on back arrow and it shows the previous day etc.
 button Scope chooses longer time period. With daily time period we can click on button Scope and the graph shows monthly period. With monthly time period we can click on button Scope and the graph shows annual period.
 button Next shifts time period one day forward. With daily time period we can click on forward arrow and it shows the next day etc.
- Since the first day of the time period
- Until the last day of the time period. If it is only one day time period the date in Since and Until boxes is the same.
- Today when you click here the current date is filled in automatically in the Since and Until boxes.
- Month (e.g. January, February…) when you click here the boxes Since the first day of that month and Until the last day of that month are filled in automatically.
- Year ( 2010, 2011…) when you click here the boxes Since the first day of that year and Until the last day of that year are filled in automatically .

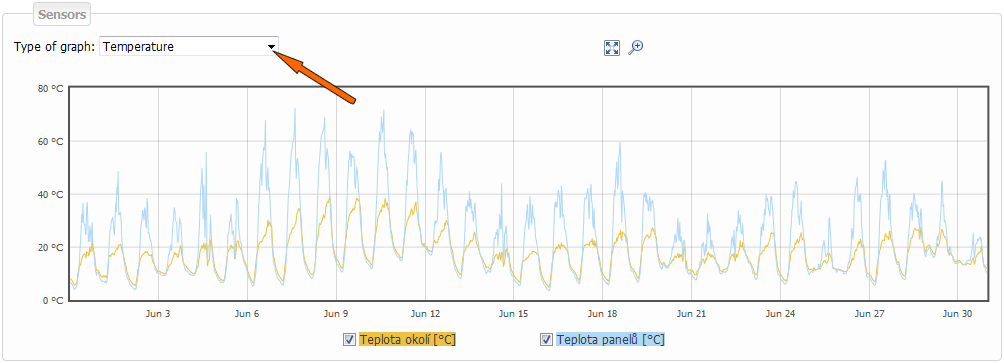
Sensors
In case you use your sensors to monitor various values (temperature, wind velocity, irradiation, etc.), select the value that you want displayed in the graph. If the particular value data come from multiple sensors, all can be displayed in one graph in different colors. The units are shown on the right side of the graph.
When you click on button  you enlarge Sensor graph into whole screen.