Overall Statement
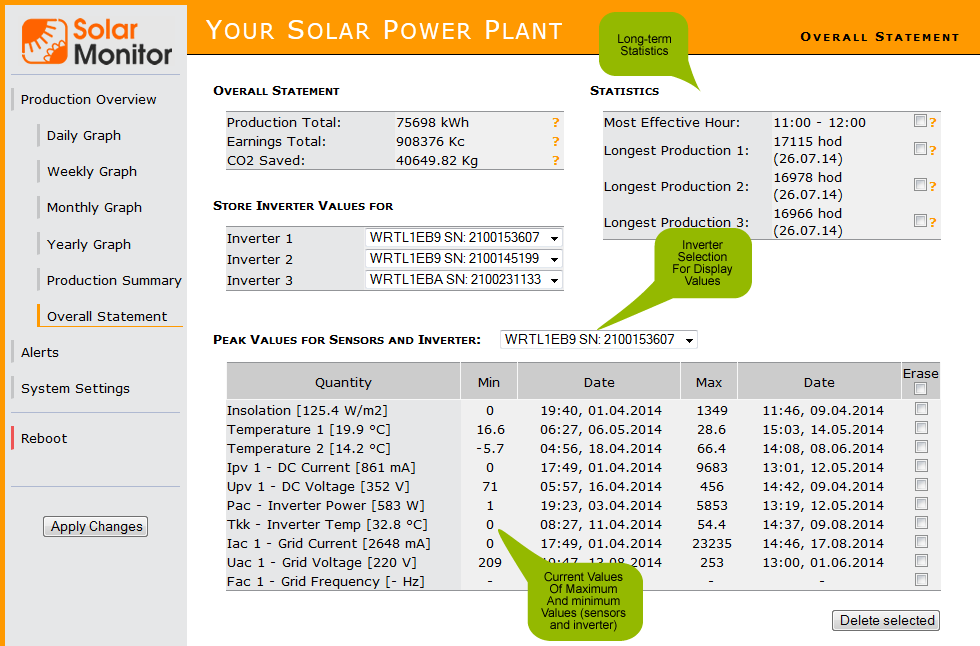
General Overview displays detailed data of your PV plant operation.

General overview
Total production, total revenue
It shows total production in kWh and Cz crowns. Financial figure is only roughly calculated, kWh multiplied by current Green Bonus purchase rate (or obligatory purchase rate). This figure doesn't take the rate changes into account.
Total amount of CO2 spared
It shows the number of CO2 in kg that would traditional production using fossil fuel produce compared to PV plant production of CO2.
Save the inverters values
Choose up to 3 inverters whose values you want to be downloaded and recorded in the table of record values.
Statistics data
The most efficient time:
It shows hour with the highest average production.
The longest production:
The longest production day of each inverter.
Records values of sensors and inverters
Table shows maximum and minimum values of sensors and inverter selected in sliding box at the top of the table. You can erase each line and start watching maximum and minimum values again.