
Solar Monitor User Guide
- Quick Setup
-
- Overview
- How to Install?
- Quick Start
- Factory Reset
- Web
-
- Extension Modules
A bar chart of your PV plant production.
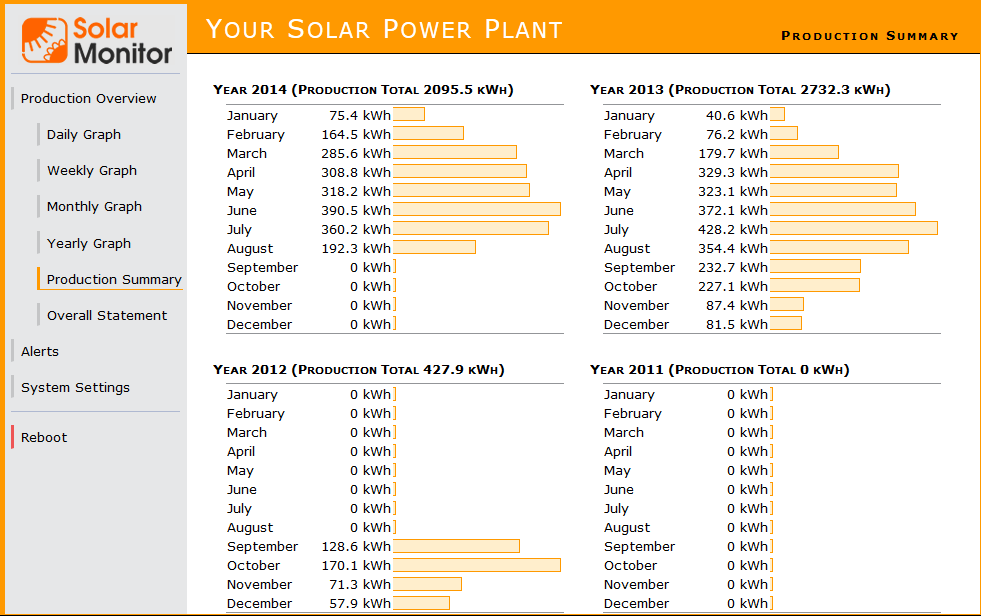
It shows power produced monthly in the last 4 years. It is a simple instrument for comparing production.
