
The Solar Monitor Portal
This web application offers detailed overview of a PV plant, data analysis and export.
- Quick Setup
- Portal
- Graphs
- Diagnostics
- Alarms
- Export
- Administration
This web application offers detailed overview of a PV plant, data analysis and export.
This is an old revision of the document!
It shows and compares the energy produced.There are two graphs. The graph on the top is a bar chart of produced energy. The lower graph can present: Production and Irradiation, Phase and Total Output, Current, Voltage, Frequency and Temperature. Right bellow the menu there is a box where you can stipulate the time period for both graphs.
Graph can show one day, month or a year period. Time period stipulates the day (days) shown in the graph.
 button Previous shifts time period one day backward. With daily time period we can click on back arrow and it shows the previous day etc.
 button Scope chooses longer time period. With daily time period we can click on button Scope and the graph shows monthly period. With monthly time period we can click on button Scope and the graph shows annual period.
 button Next shifts time period one day forward. With daily time period we can click on forward arrow and it shows the next day etc.
Since the first day of the time period
Until the last day of the time period. If it is only one day time period the date in Since and Until boxes is the same.
Today when you click here the current date is filled in automatically in the Since and Until boxes.
Month (e.g. January, February…) when you click here the boxes Since the first day of that month and Until the last day of that month are filled in automatically.
Year ( 2010, 2011…) when you click here the boxes Since the first day of that year and Until the last day of that year are filled in automatically .

Green bars in the first graph show the energy produced. Daily graph shows the total of energy produced per hour. Monthly graph shows energy produced per day. Annual graph shows total per each month.
Solar Monitor unit sends the data for graphs. Minimum value to be send is 1kWh. That is why no graph is available on cloudy days, you can see only No data available…report. This report means that less than 1kWh was produced in that particular time period.
The energy produced can be measured by electrometer. This is accurate and favorite option. Second option is getting the values straight from the inverter . But errors can appear due to inverter measuring and loss in the wiring. The measured values are rather inaccurate. 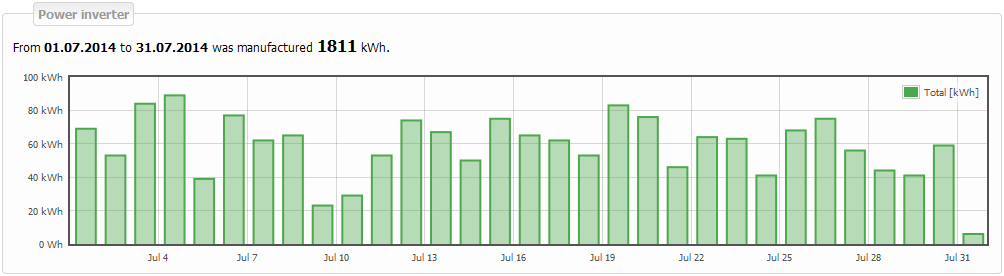
Graf Veličiny a střídače je liniový. V denním pohledu zobrazuje všechna přijatá data (dle nastaveného intervalu, min. 5 minut). Při intervalu větším než dva dny se data průměrují (pomocí aritmetického průměru) z příjatých dat za časový interval 30 minut. Pokud zobrazený interval přesáhne 30 dní, zobrazená data se průměrují (pomocí aritmetického průměru) z přijatých za časový interval 24 hodin.
Tento graf umožňuje zobrazit hodnoty poskytované přímo střídačem. Zobrazení konkrétní veličiny lze zvolit v checkboxu Typ grafu. K dispozici jsou tyto možnosti: Výkon s osvitem, Fázový a celkový výkon, Proud, Napětí, Frekvence, Teplota. Protože data pro tento graf poskytují přímo střídače, zobrazí se pouze to, co poskytuje Váš konkrétní typ střídače. Jinými slovy může se stát, že některý graf bude prázdný. Jediná data pro osvit neposkytuje střídač, ale senzor osvitu.
Druhý checkbox Střídače umožňuje zvolit konkrétní monitorovaný střídač, pro který se vykreslí graf

