The Solar Monitor Portal
This web application offers detailed overview of a PV plant, data analysis and export.
- Quick Setup
- Portal
- Graphs
- Diagnostics
- Alarms
- Export
- Administration
This web application offers detailed overview of a PV plant, data analysis and export.
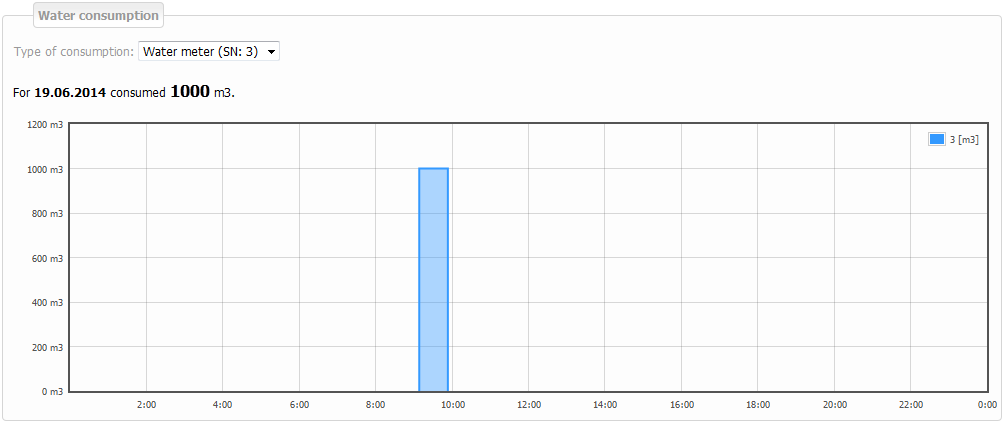
It shows information on water consumption in selected time period.
Graph can show daily, monthly or annual values. Daily graph includes 24 samples of each value. Monthly and annual graphs show one sample of each value on particular day. Time period stipulates the day (days) that the graph should show.
 button Previous shifts time period one day backward. With daily time period we can click on back arrow and it shows the previous day etc.
 button Scope chooses longer time period. With daily time period we can click on button Scope and the graph shows monthly period. With monthly time period we can click on button Scope and the graph shows annual period.
 button Next shifts time period one day forward. With daily time period we can click on forward arrow and it shows the next day etc.
* Since the first day of the time period
* Until the last day of the time period. If it is only one day time period the date in Since and Until boxes is the same.
* Today when you click here the current date is filled in automatically in the Since and Until boxes.
* Month (e.g. January, February…) when you click here the boxes Since the first day of that month and Until the last day of that month are filled in automatically.
* Year ( 2010, 2011…) when you click here the boxes Since the first day of that year and Until the last day of that year are filled in automatically.

Blue colour shows the water consumption. Units (m3 ) to be found on the left side of the graph.

The source of information on water consumption. In case of multiple water meters, you can select a particular water meter or all water meters simultaneously.