
en:sim:manual:prehledy:grafy
Toto je starší verze dokumentu!
Graphs
Solar Monitor unit provides interactive graphs of sensor and production values.
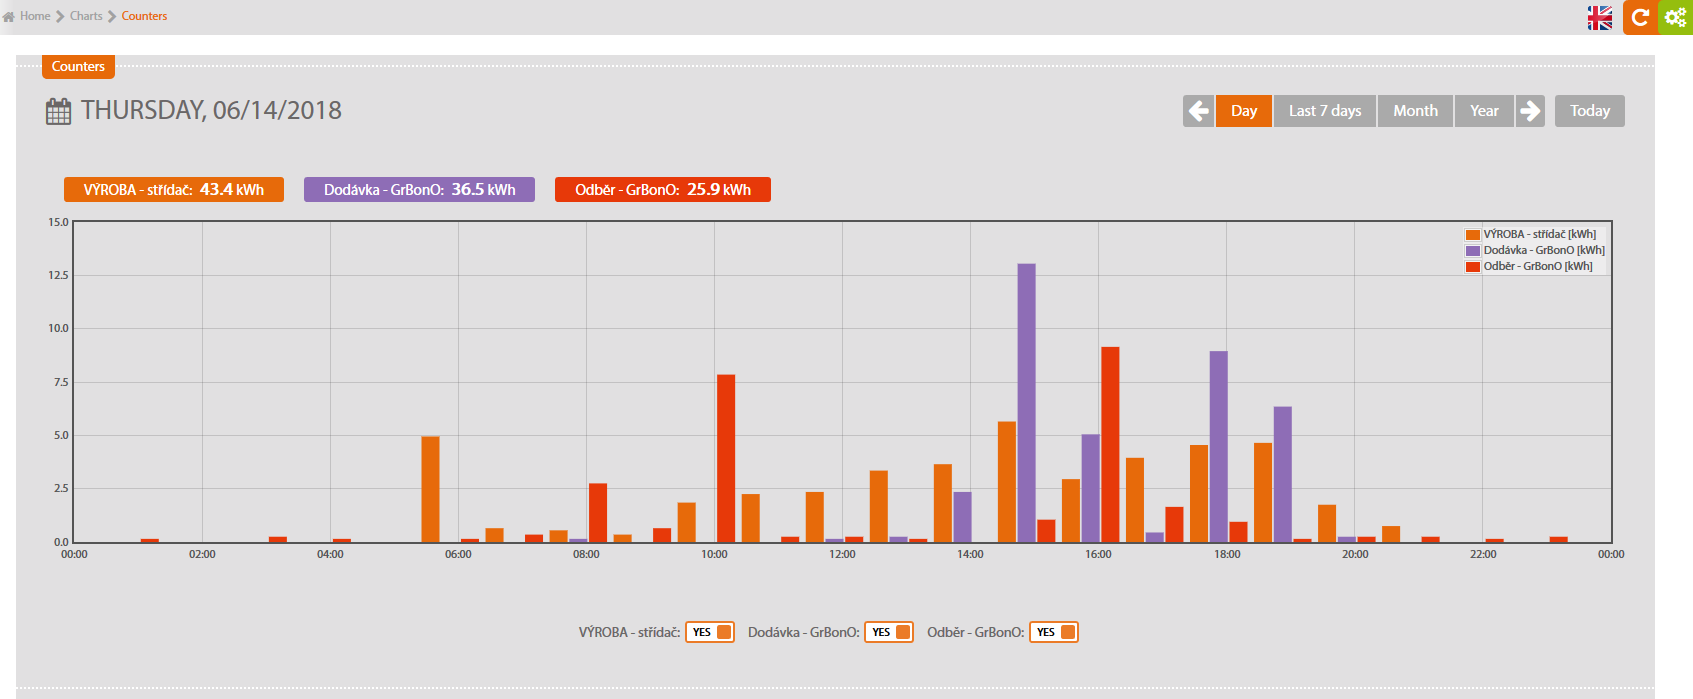
Daily, Weekly, Annual Graph
These graphs show values of each connected sensor and power produced. There is automatic zoom function when you select particular sensor. When you run a mouse on graph's line, the nearest value and time entry are shown.
Notice: if you need more detailed summary, ask for info on using our portal. See www.solarmonitor.cz
en/sim/manual/prehledy/grafy.1387385570.txt.gz · Poslední úprava: 2013/12/18 17:52 autor: jitka