Data for audit
You can enter the data for audit that compares real and estimated production of PV plant in a selected year.
PVGIS data configuration
It enables getting information about photovoltaic panels setting and finding out annual energy output. Right placement of the panels is key technical parameter of PV plant installation. Key factors are location, angle of panels and their position regarding the South.
Estimated losses of the system
Select estimated losses of the system in %. The losses depend on technical quality of photovoltaic system. It used to be about 14 % but new modern photovoltaic systems have only about 10 - 11% loss.
Module's angle [0..90]
It is an angle between a panel and horizontal base. Ideal angle in central Europe is 36 °, but angle between 25° – 60° guarantees minimum loss. It means that approximate figure is acceptable.
Module's position [-180..180] (E:-90 S:0)
Enter panel's angle from the ideal south position. Attention: if panel is diverted to the East, you have to enter minus in front of angle (-). Ideal position in central Europe is 1° South West.
Latitude
Enter GPS latitude coordinates of your PV plant. With kombo  select (N) North or (S) South latitude.
Longitude
Enter GPS longitude coordinates of your PV plant. With kombo  select (E) East or (W) West longitude.
Once you have entered GPS coordinates of your PV plant click on display button 
You will see charts with energy production per each month according to PVGIS a ČHMÚ.
Note: You can get your coordinates automatically from your IP address when you click on My position button 

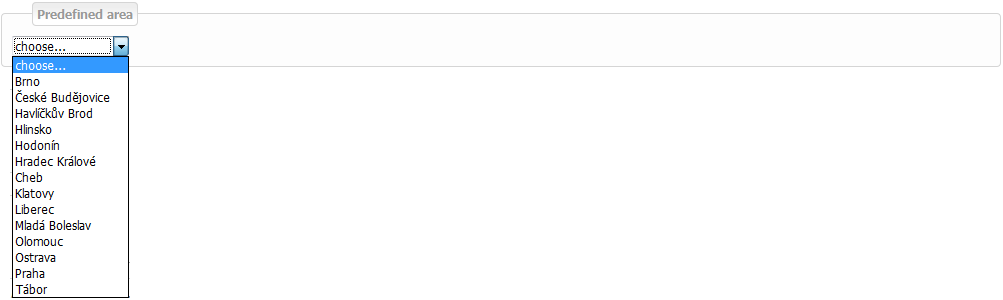
Predefined locations
Further option of getting data is direct selection from locations listed here..
Click here to see the menu  Select appropriate location.
Data according to the PVGIS
Chart with energy production per each month according to the PVGIS.

Data according to the ČHMÚ (Czech Hydrometeorological Office)
Chart with energy production per each month according to the ČHMÚ.

Remember to save changes after each setup.