
en:sim:manual:prehledy:statistika
Toto je starší verze dokumentu!
Statistics
A bar chart of your PV plant production.
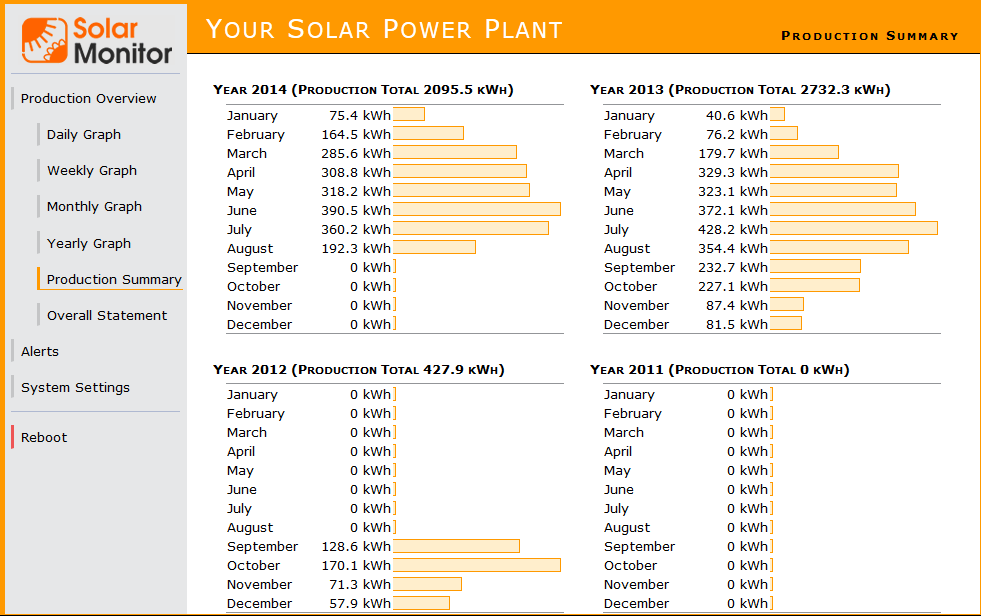
It shows power produced monthly in the last 4 years. It is a simple instrument for comparing production.
en/sim/manual/prehledy/statistika.1409056200.txt.gz · Poslední úprava: 2014/08/26 14:30 autor: ondra